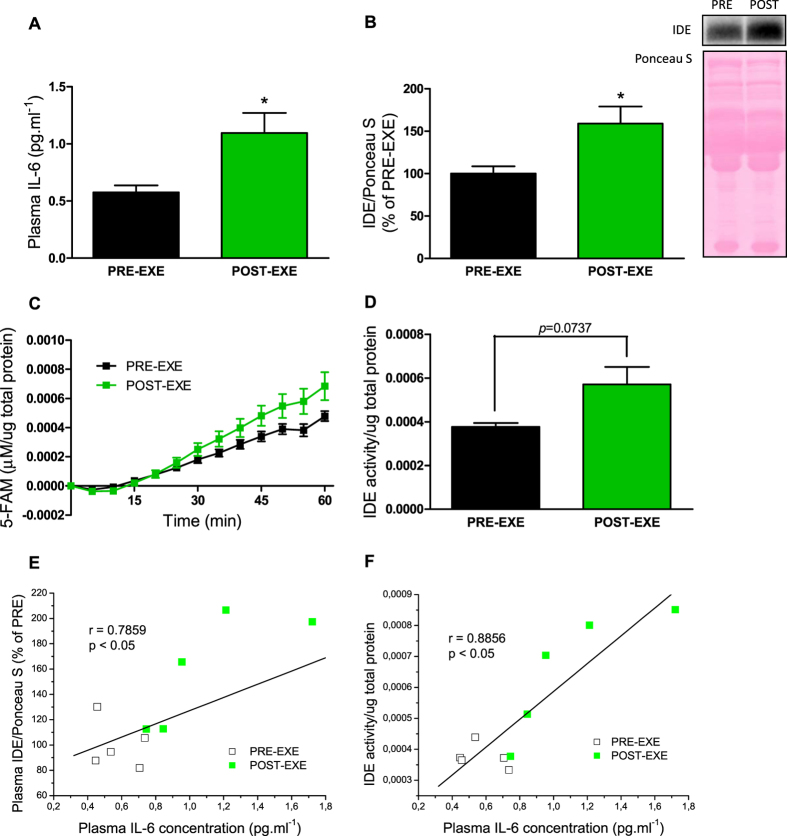
Figure 6. IL-6 concentration and IDE protein expression and activity in the plasma of human subjects, before and after acute endurance exercise.
Plasma IL-6 concentration (A), n = 5. IDE protein expression and its representative immunoblotting image (B), n = 5. Kinetic of IDE activity assay in the plasma (C), n = 5. Fluorescent intensity at Ex/Em = 490/520 nm was continuously recorded, every 5 min, during 60 min. 5-FAM concentration was calculated using a standard curve and normalized per μg of total protein. Total IDE activity (D) was calculated as described27 and normalized per μg of total protein, n = 5. Data represent the mean ± S.E.M. *p ≤ 0.05 vs PRE-EXE. Correlation between plasma IL-6 concentration and IDE protein expression (E) or IDE activity (F), n = 10. The Pearson product moment correlation coefficient (r) was determined using the software GraphPad Prism 5. PRE-EXE, plasma samples of human subjects before acute endurance exercise; and POST-EXE, plasma samples of human subjects 3-h after acute exercise (30-min cycling at 70% of VO2peak).

