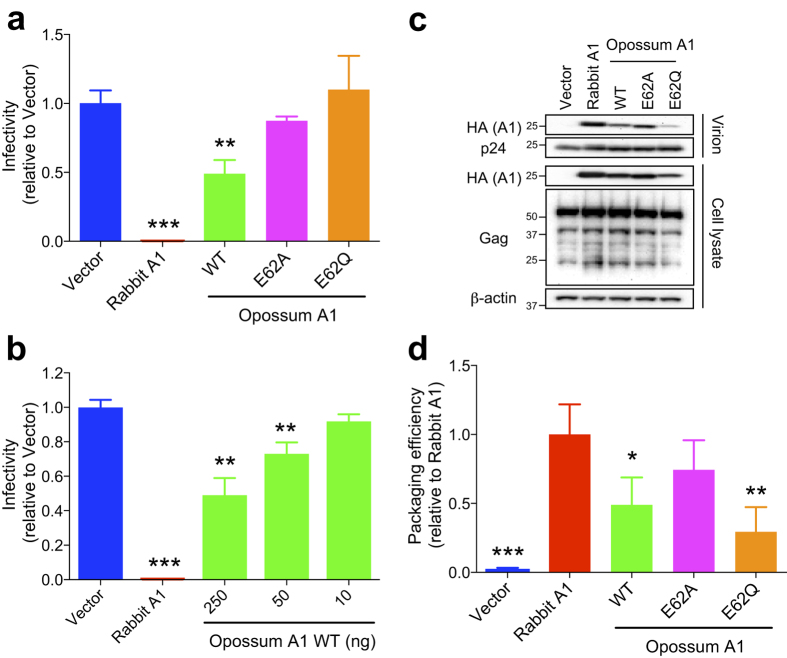
Figure 2. HIV-1 restriction by opossum A1.
(a) Representative single-cycle assays with WT opossum A1 or deaminase-defective mutants (E62A or E62Q). Viral infectivity is plotted relative to vector control and is proportional to luciferase activity (n = 3, average +/− SD). P values are derived by comparisons with vector control data. (b) Representative single-cycle assays with varying concentrations of WT opossum A1 (10, 50 and 250 ng). Data represent the luciferase activity relative to vector control data (n = 3, average +/− SD; P-values as above). (c) Immunoblots of A1 in viral particles and cell lysates. A1 and HIV-1 Gag were detected using anti-HA anti-p24 antibodies, respectively. β-actin expression was used a loading control. (d) A histogram showing the relative packaging efficiency of each A1 construct. Band intensity of each HA-tagged A1 was normalised to the corresponding p24 level. Packaging efficiency is shown graphically relative to the packaging of rabbit A1 (n = 3, average +/− SD). P values represent comparisons with rabbit A1 data.

