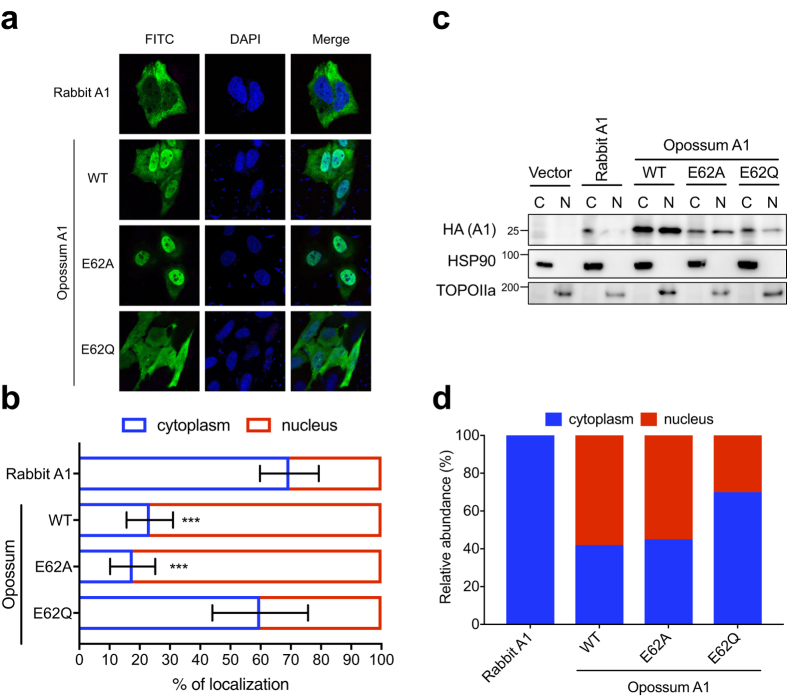
Figure 3. Subcellular localisation and expression levels of opossum A1 in HeLa cells.
(a) Representative images showing HA-tagged A1s in green (FITC) and nuclei in blue (DAPI). (b) Quantification of the subcellular distribution of the indicated A1 constructs. The percentage nuclear and cytoplasmic localisation is indicated as the graphs (n = 20, average +/− SD). P values represent comparisons with rabbit A1. (c) Nuclear (N) and cytoplasmic (C) expression levels of A1s. Each cell fraction was blotted and probed with anti-HA, anti-HSP90, and anti-TOPOIIa antibodies. (d) Relative abundance of each A1 in nuclear or cytoplasmic fractions (percentage calculated based on combined intensity of C and N bands).

