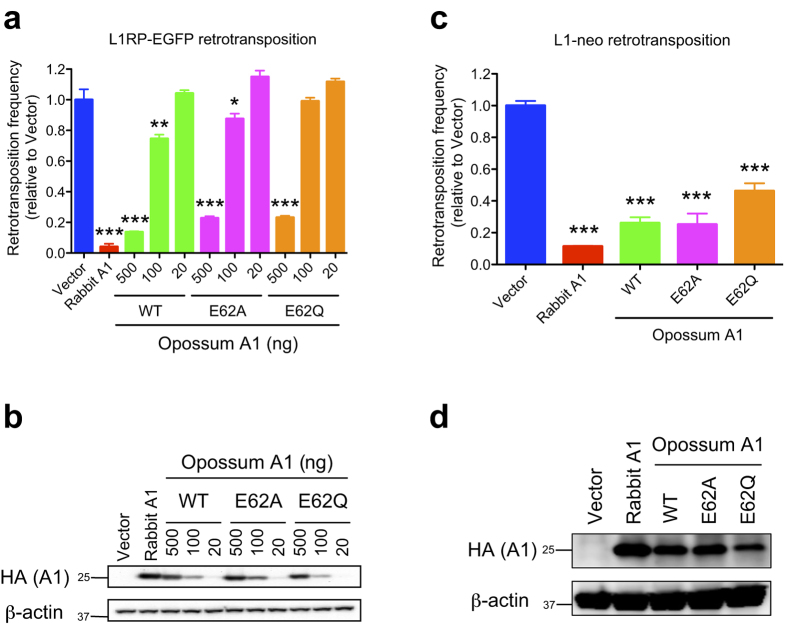
Figure 5. Restriction of L1-GFP retrotransposition by opossum A1.
(a) Representative L1RP-GFP retrotransposition assays with varying concentrations (20, 100, or 500 ng) of WT opossum A1, or its catalytic mutants (E62A or E62Q). Retrotransposition frequency is presented relative to vector control data (n = 3, average +/− SD). P values represent comparisons with vector control data. (b) Immunoblotting of the indicated HA-tagged A1s expressed in HEK293T cells, with β-actin as the loading control. (c) A representative L1-neo retrotransposition assay with opossum A1 WT, or its catalytic mutants (E62A or E62Q). Retrotransposition frequency is presented relative to vector control data (n = 3, average +/− SD). P values represent comparisons with vector control data. (d) Immunoblotting of the indicated HA-tagged A1s expressed in HEK293T cells, with β-actin as the loading control.

