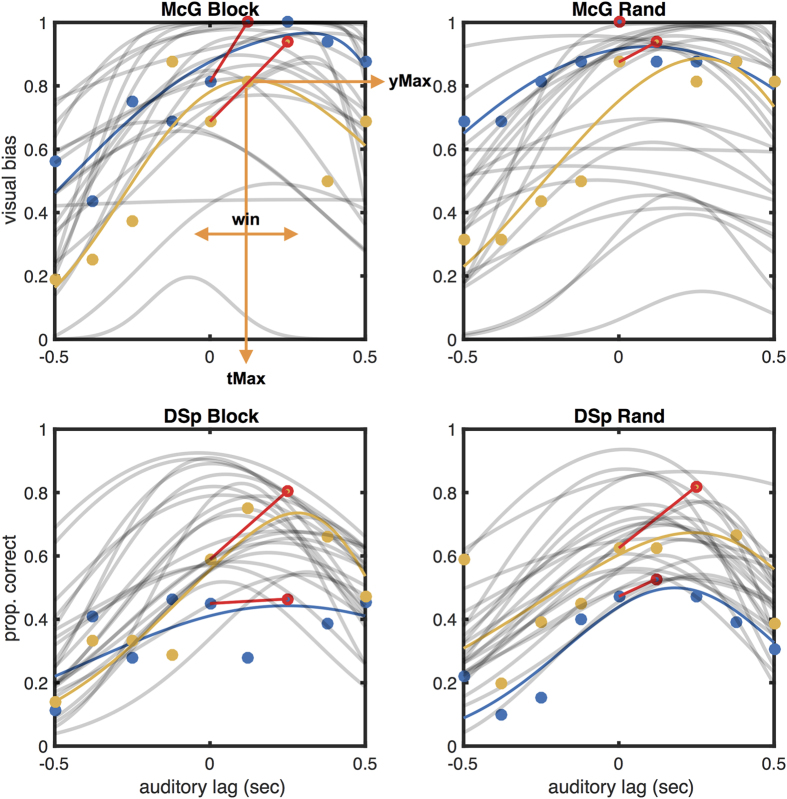
Figure 2. Sample raw data and best fitting functions for two participants (blue and yellow symbols), with fits for all other participants (grey lines).
Separate panels for different task and conditions. Best fitting functions are shown as coloured lines for selected participant, and as light lines for all others. Orange arrows illustrate the three parameters extracted from the fitted function, and red lines and symbols illustrate the method of estimating the benefit of asynchrony for audiovisual integration from the empirical peak of the asynchrony function.

