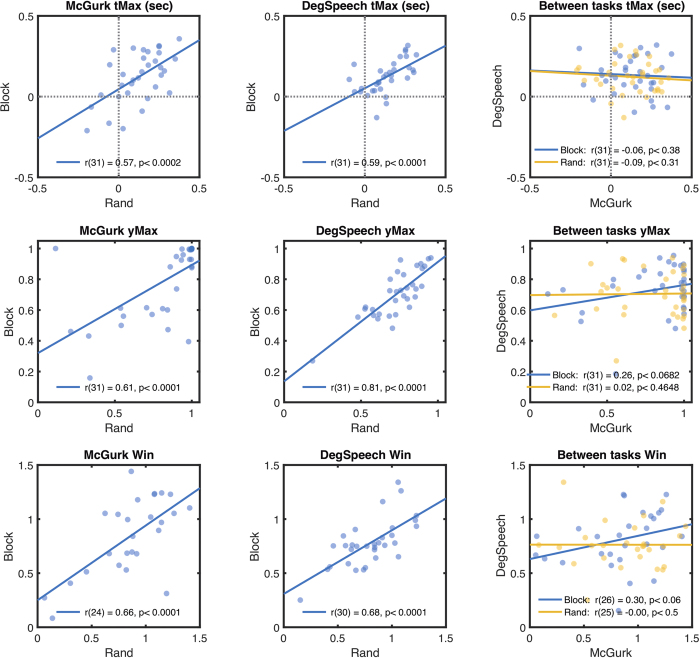
Figure 3. Performance measures replicate across repetitions of the same tasks, but not between different tasks.
Rows of graphs respectively plot tMax, yMax and Win parameters, extracted from fitted functions. Left and middle columns respectively plot significant within-task correlations for the McGurk and Degraded Speech tasks (blocked versus random conditions). Rightmost column plots non-significant between-task correlations with separate colours for Random and Blocked conditions. Correlation statistics (one-tailed) are shown in legends.

