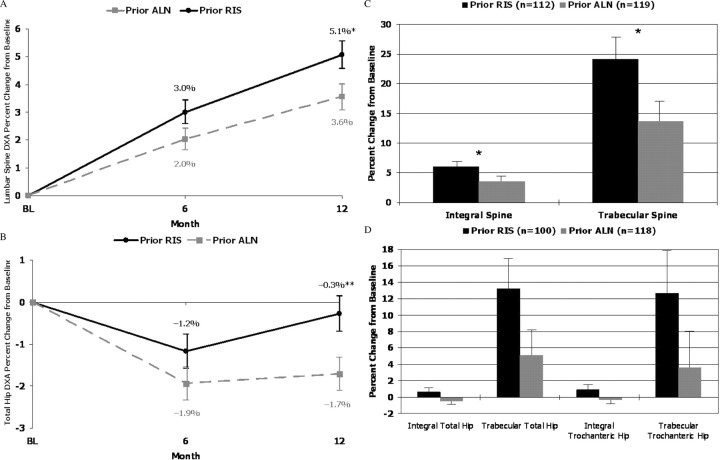
Fig. 3.
Comparison of BMD changes from baseline (BL) (completer population). A, DXA of the lumbar spine, percent change from baseline. B, DXA of the total hip, percent change from baseline. C, QCT of the integral and trabecular spine, percent change from baseline. D, QCT of the integral and trabecular total and trochanteric hip, percent change from baseline. *, P < 0.05; **, P < 0.01. ALN, Alendronate; RIS, risedronate.

