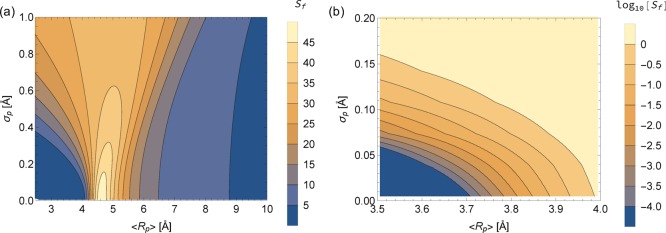
Figure 3.
Selectivity of Xe to Kr mapped onto the average pore radius (x dimension) and the distribution width of the radius (y dimension) for the fluctuating pore model. The color scale in (a) is a linear scale of the flexible selectivity, Sf, whereas the color in (b) is the log10 scale of Sf to better emphasize the gradients that exist over small changes in ⟨Rp⟩ and σp.

