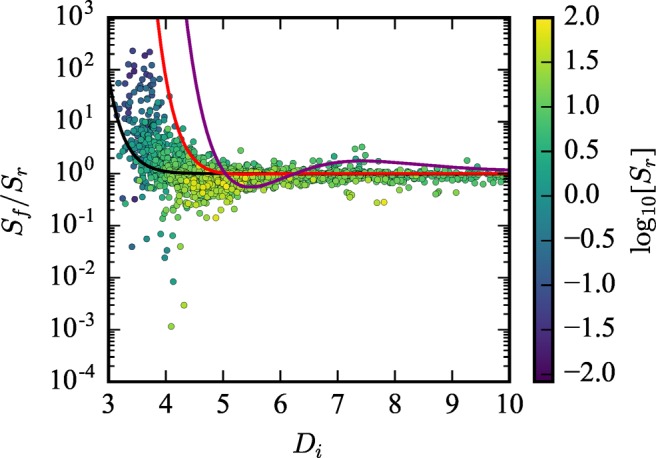
Figure 7.

Relative error from the rigid structure approximation, Sf/Sr, is plotted in log10 scale against Di. Each material is color-coded by log10[Sr]. The screening results are compared to the analytical model where the solid black, red, and purple lines represent Sf(Di, σp = 0.005)/Sr(Di), Sf(Di, σp = 0.04)/Sr(Di), and Sf(Di, σp = 0.35)/Sr(Di), respectively.
