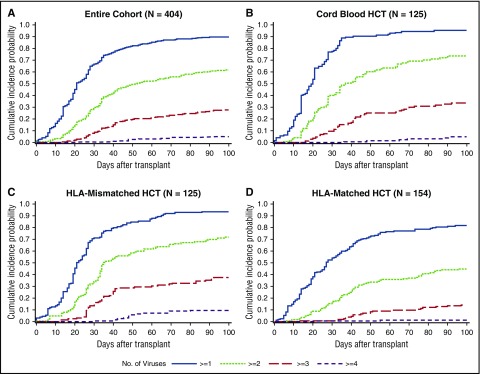
Figure 2.
Cumulative incidence plot of time to any dsDNA virus detection by day 100 post-HCT. (A) The cumulative incidence of each category of the number of viruses detected is demonstrated in the entire cohort. The cumulative incidences are higher in each category among cord blood HCT recipients (B) and HLA-mismatched HCT recipients (C) than among HLA-matched HCT recipients (D).

