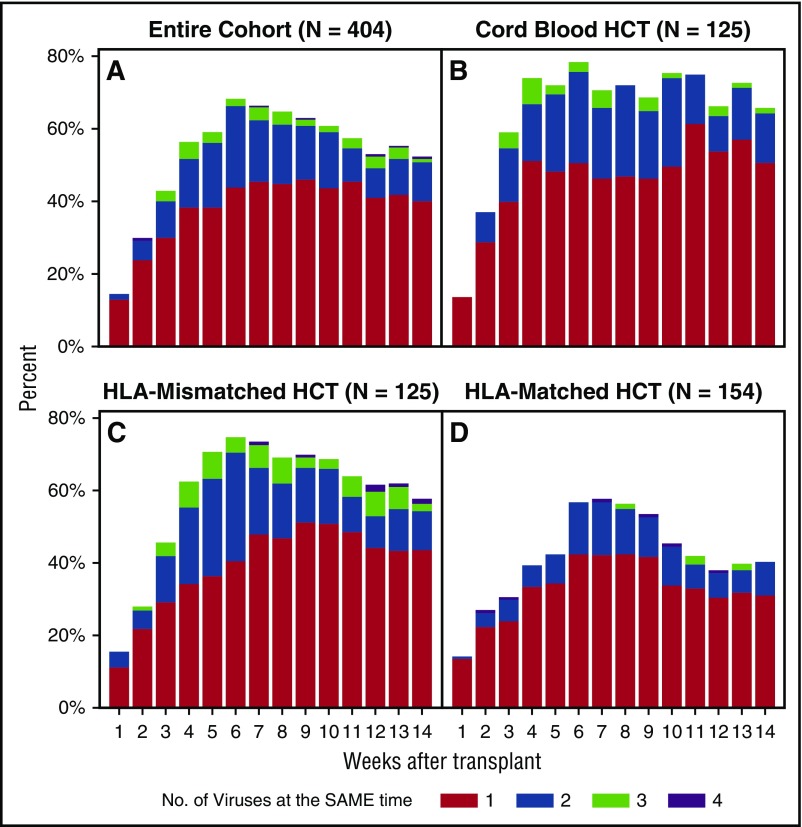
Figure 3.
Histogram of the weekly proportion of patients with concurrent detection of multiple dsDNA viruses. The proportion of patients with multiple viruses detected per week in the entire cohort (A), cord blood HCT recipients (B), HLA-mismatched related or unrelated HCT recipients (C), and HLA-matched related or unrelated HCT recipients (D).

