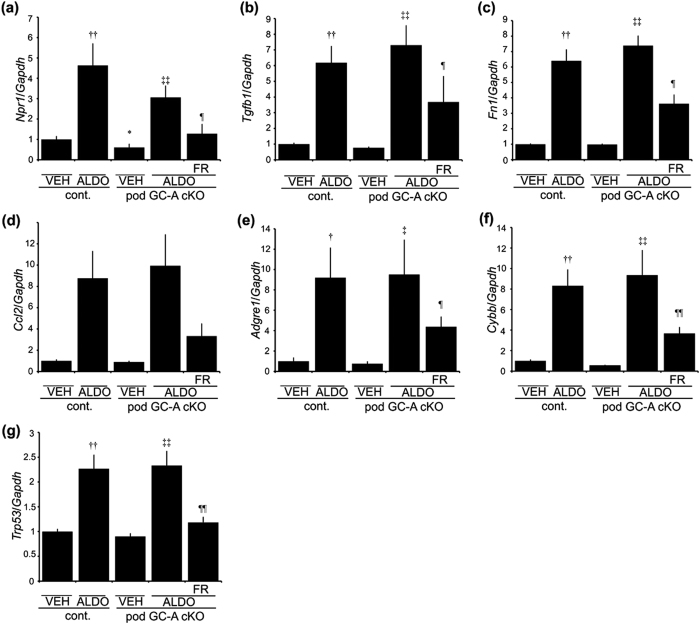
Figure 6. Glomerular mRNA expression at 4 weeks after aldosterone administration.
Real-time RT-PCR analysis of Npr1 (a; GC-A), Tgfb1 (b; TGF-β1), Fn1 (c; Fibronectin), Ccl2 (d; MCP-1), Adgre1 (e; F4/80), Cybb (f; Cybb), Trp53 (g; p53) are shown. Mean ± SEM. ††p < 0.01, vs. VEH control mice. ‡p < 0.05, vs. VEH control mice. ‡‡p < 0.01 vs. VEH pod GC-A cKO mice. ¶¶p < 0.01 vs. ALDO pod GC-A cKO mice.

