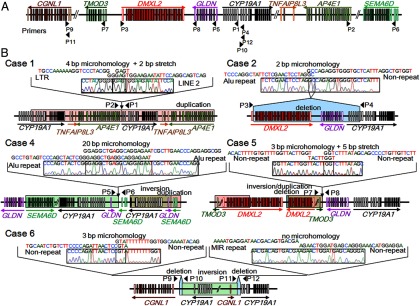
Figure 2.
Fine genomic structures of the rearrangements. A, Schematic representation of the normal genomic structure. Arrowheads indicate the positions and the directions (5′→3′) of PCR primers utilized in this study (P1–P12). The open and color-painted boxes denote noncoding and coding exons, respectively. The sizes of the exons, introns, and primers are not drawn to scale. B, Schematic representation of the rearrangements and the DNA sequences at the fusion junctions. The red, blue, and green areas indicate duplications, deletions, and inversions, respectively. P1–P12 indicate the same PCR primers as shown in panel A. The fusion junctions of case 3 were not characterized. For case 4, the precise genomic position of the duplication remains to be clarified.

