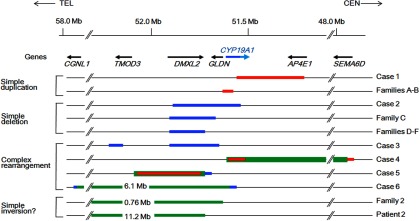
Figure 3.
Schematic representation of the 11 rearrangements. Cases 1, 2, and 4–6 are from the present study, and patients from families A–F, patient 2, and patients from family 2 have been reported previously (1, 2, 5). The genomic abnormalities of case 3 were not characterized. The arrows indicate the positions and transcriptional direction of CYP19A1 and its neighboring genes (5′→3′). Only genes around the fusion junctions are shown. The red, blue, and green lines indicate duplications, deletions, and inversions, respectively. For CYP19A1, the dark and light blue lines denote the genomic regions for the noncoding and coding exons, respectively. The inversions of family 2 and patient 2 may be complex rearrangements because copy-number analyses have not been performed in these cases.

