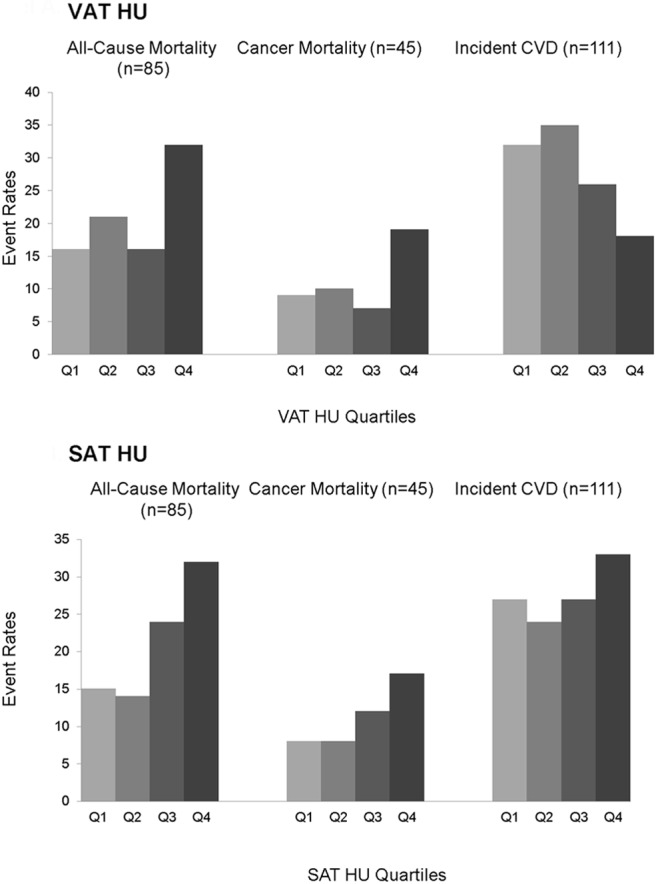
Figure 1. Event rates for all-cause mortality, cancer mortality, and incident CVD by quartiles of VAT HU and SAT HU.

Quartile 1 (Q1) indicates the most negative HU quartile, whereas Q4 indicates the least negative HU quartile.

Quartile 1 (Q1) indicates the most negative HU quartile, whereas Q4 indicates the least negative HU quartile.