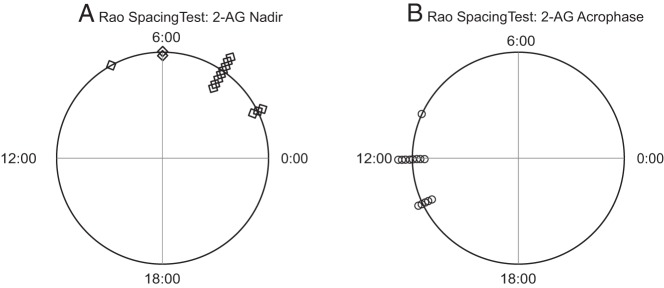
Figure 2. Polar diagrams representing the temporal distribution of the individual nadirs, denoted with diamonds (A), and acrophases, denoted with circles (B), of the 2-AG profiles.
Both the nadirs and the acrophases were significantly clustered (P < .001) of periodic data against the hypothesis of uniform distribution across the 24-hour cycle.

