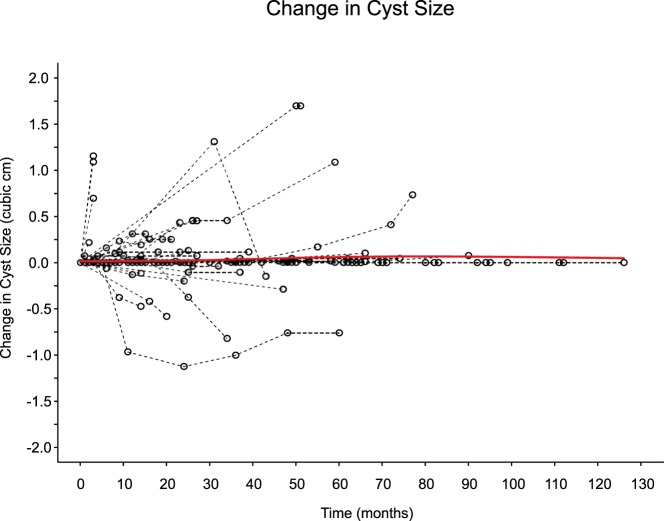
Figure 1. Subject profiles for change in cyst size (cubic centimeters) vs surveillance time (months).
The dashed lines identify the individual subject time profiles, and the solid red line identifies the predicted marginal profile time produced by a 2-degree gamma additive model spline function of time.

