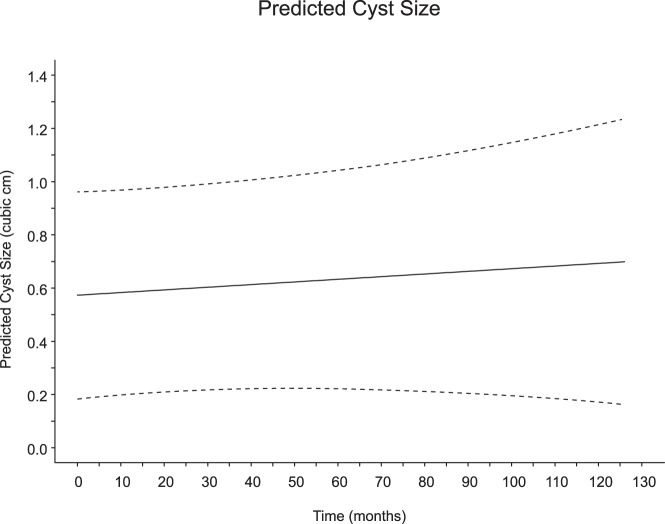
Figure 2. Random coefficient regression predicted cyst size (cubic centimeters) as a linear function of surveillance time (months).
The solid line identifies the predicted marginal (ie, average) cyst size, and the dashed lines denote the lower and upper limits of the simultaneous 95% CI. The slope of the regression (0.0010 cm3/mo; 95% CI, −0.0015 to 0.0035 cm3/mo; P = .427), represents the predicted mean cyst growth rate, and because the 95% CI includes 0, this implies that the null hypothesis that the mean cyst growth rate is equal to 0 cannot be rejected.

