
Figure 1.
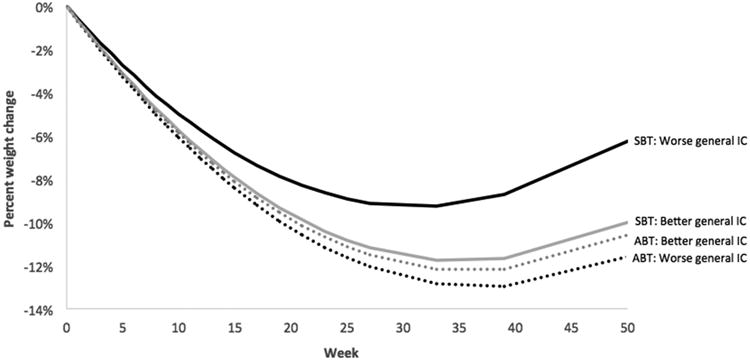
Percent weight change over time by treatment and general inhibitory control (IC), The time × condition × neutral IC was statistically significant (p = .03). Analyses were conducted with IC as a continuous variable, but IC was dichotomized above for graphical purposes. Better IC is defined as those who scored in the upper quartile of SSRT-neutral, and worse as those who scored in the lower quartile.