
Figure 3.
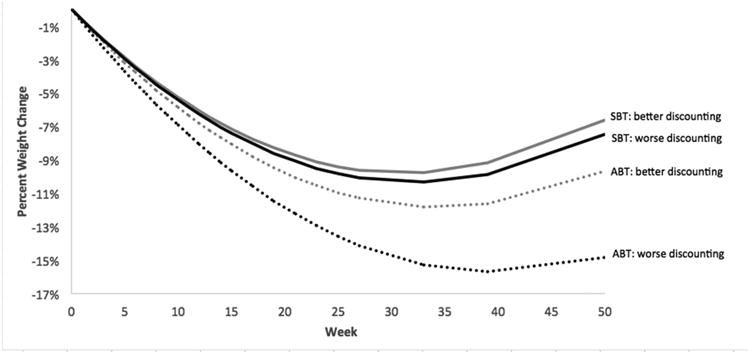
Percent weight change over time by treatment and delay discounting, The time × condition × delay discounting interaction was marginally significant (p < .10). Delay discounting was dichotomized above for graphical purposes. Better delay discounting (i.e., less discounting) is defined as those who scored in the upper quartile, and worse as those who scored in the lower quartile.