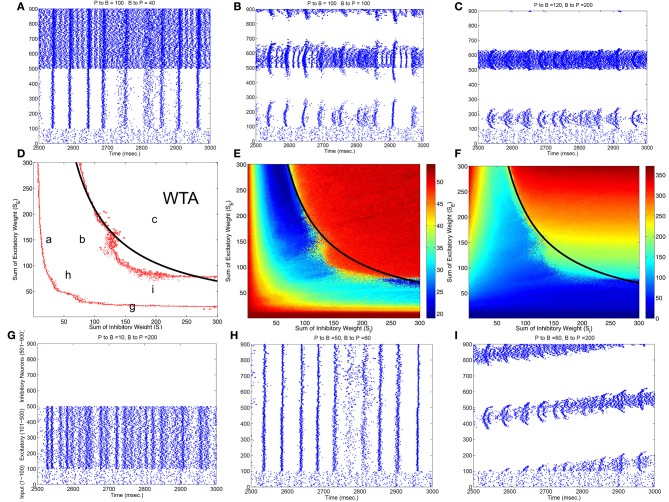
Figure 2.
Classification of different dynamic spiking patterns in the surround inhibition network we defined in Figure 1 and the phase diagram for the transition between different firing states. (A–C,G–I) Are raster plots which show all spikes within a half second interval for each neuron in the network. (E,F) are maximal firing rates of excitatory and inhibitory neurons in the 2-d parameter space (total excitatory weight in y-axis and total inhibitory weight in the x-axis). Red Points in (D) are transition curves constructed from (E) where maximal firing rate of excitatory neurons changed from below to above 40 Hz. (A–C,G–I) Are example spiking patterns under their specific parameter combinations which are marked on the 2-d plot in (D). Subplot (C) represents a winner-take-all (WTA) state where only a small group of excitatory and its corresponding inhibitory neurons fire persistently while others are silent. Black curves on the middle row–(D,E,F) are the same analytic transition condition for the WTA region based upon the analysis described in the Appendix (Equation A.14). Basically it is a curve where SE · SI equals to a constant defined by Equation (A.14), and it delineates the Winner-Take-All region (i.e., max firing rate large than 40 Hz for only a selected group of excitatory neurons) in the parameter space very well for both the excitatory and inhibitory neurons.

