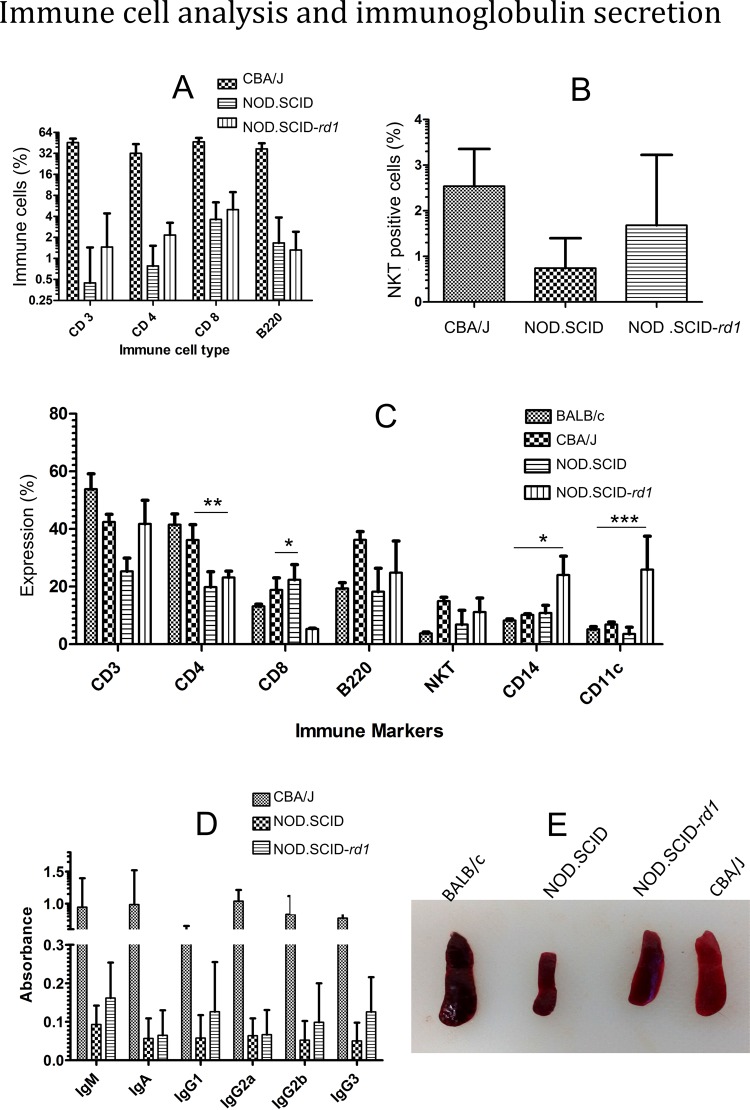
Fig. 2.
Immune cell analysis and relative immunoglobulin quantification. Graphical representation of flow cytometric analysis of immune cell markers in (A,B) peripheral blood (n=15) and (C) spleen of CBA/J, NOD.SCID-rd1 and NOD SCID strains of mice (n=5). The peripheral blood analysis revealed that there is no significant difference in the level of CD3+, CD4+, CD8+, B220+ and NKT+ cells between NOD.SCID-rd1 and NOD SCID, suggesting immunocompromised nature of NOD.SCID-rd1. Moreover, the CD4+ and CD8+ T cells in NOD.SCID-rd1 spleen were significantly reduced compared with CBA/J while showing a drastic increase in CD14+ and CD11c+ cell population. (D) Relative quantification of immunoglobulin secretion for CBA/J, NOD SCID and NOD.SCID-rd1 through ELISA (n=10). The result indicated no significant difference between NOD.SCID-rd1 and NOD SCID immunoglobulin levels. (E) Representative images showing spleen size in BALB/c, CBA/J, NOD.SCID-rd1and NOD SCID, respectively. The BALB/c mouse had largest spleen size while NOD SCID had the smallest spleen. CBA/J, however, had reduced size of spleen compared with BALB/c while NOD.SCID-rd1 has an intermediate size of spleen lying between CBA/J and NOD SCID (parent strains). ***P≤0.001, **P<0.01 and *P≤0.05.

