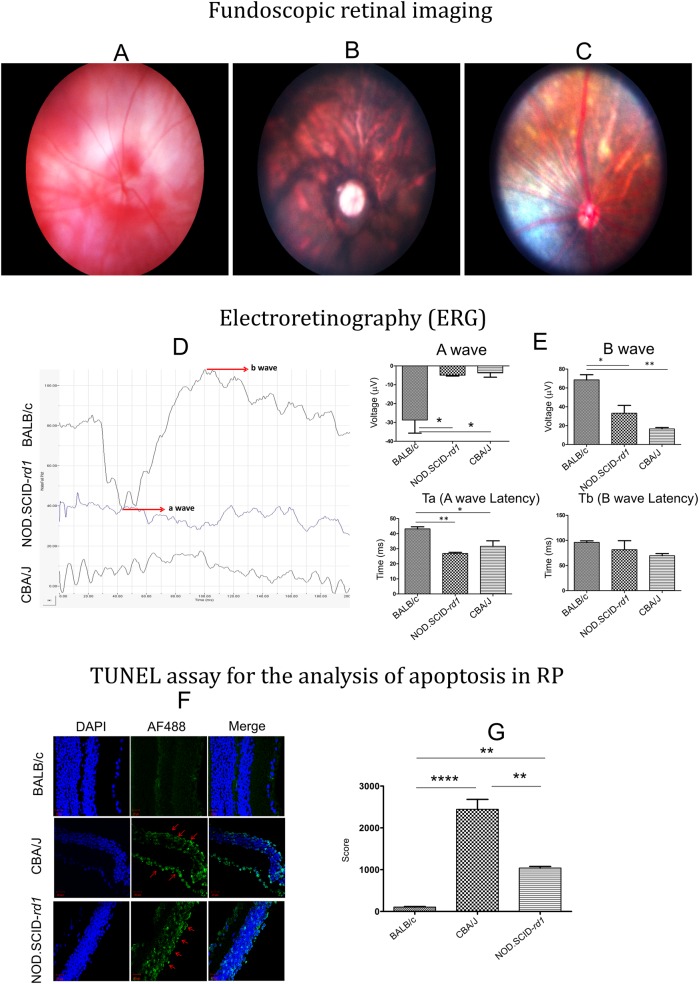
Fig. 5.
Fundoscopic imaging, ERG analysis of retina and apoptosis during RP. (A-C) Representative fundoscopic retinal images for the analysis of retinal degeneration and vessel attenuation in BALB/c, CBA/J and NOD.SCID-rd1, respectively at 4 weeks of age. Both CBA/J and NOD.SCID-rd1 showed patched retina, however, the severity of attenuated vessels and patchy appearance was aggravated in CBA/J as compared to NOD.SCID-rd1. BALB/c, which had normal vision, exhibited no patches and clear red vessels were visible throughout retina. (D,E) Electroretinogram analysis of BALB/c, CBA/J and NOD.SCID-rd1 at 4 weeks of age. BALB/c exhibited distinct a- and b-wave peaks while NOD.SCID-rd1 and CBA/J had no a- and b-wave peaks with reduced a-wave latency indicating the degeneration of photoreceptors (rods and cones) as well as improper functionality of retinal bipolar cells. (F,G) Representative images illustrating apoptosis during retinal degeneration in CBA/J and NOD.SCID-rd1 as compared to normal vision BALB/c. Ten random fields were scored for apoptotic cells in each case and graphically plotted. The result shows an extremely high apoptotic rate of retinal cells in CBA/J. While NOD.SCID-rd1 also shows apoptosis, it still remained significantly lower than CBA/J. The green color represents TUNEL-positive Alexa Fluor 488-stained apoptotic cells. Nuclei are stained blue with DAPI.

