Fig. 1.
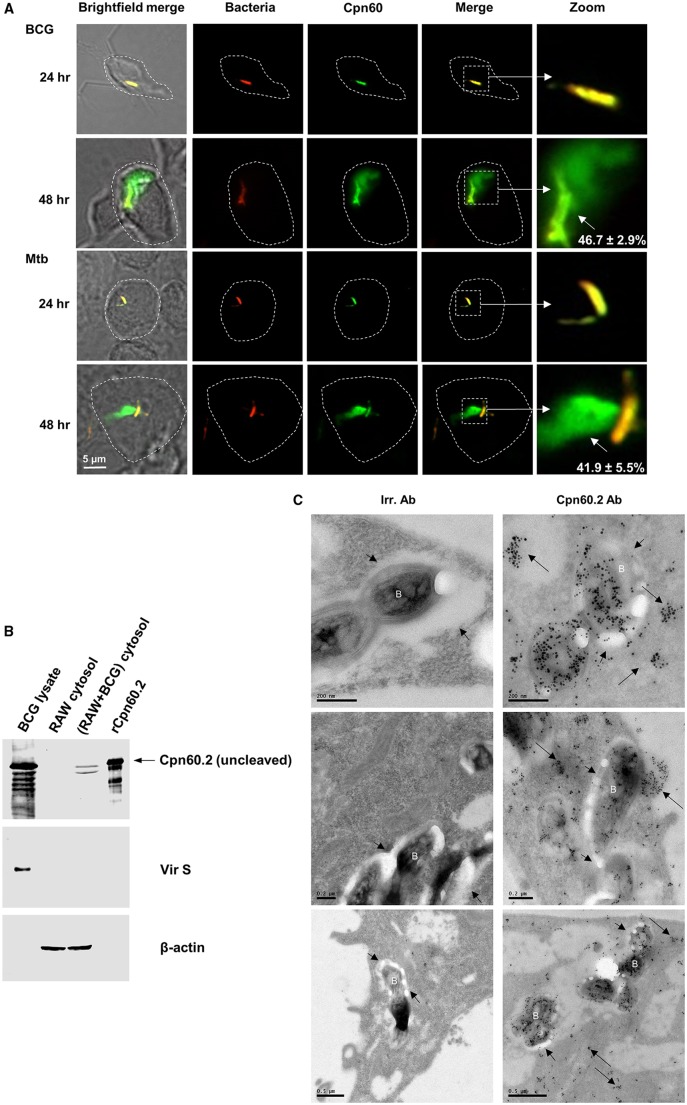
Cpn60.2 exits phagosomal membrane in BCG- and Mtb-infected macrophages. (A) RAW macrophages were infected with red-fluorescent-BCG and -Mtb (MOI, 20:1) for the indicated time periods. Cells were then stained with Cpn60.2 antibody (1:100) and FITC-conjugated goat anti-rabbit IgG (1:3000) (green fluorescence) and analyzed by confocal microscopy. Yellow signal in merged images (4×magnification panels) indicates bacteria-associated Cpn60.2 while green signal (short arrows) indicates Cpn60.2 diffusion beyond phagosomes. Dotted lines indicate the macrophage cell boundary. Values are means±s.d. of diffused Cpn60.2 observed in 50-60 cells from three independent experiments. (B) Cytosolic fractions from uninfected or BCG-infected macrophages were subjected to SDS-PAGE along with BCG lysate (2 µg) and rCpn60.2 (60 ng) and western blotted with Cpn60.2 antibody (1:500). Membranes were revealed with AF680-conjugated goat anti-rabbit IgG (1:10,000). Blots were then stripped, re-probed with Vir S antibody (1:1000) to control for the bacterial contamination (middle panel) and and β-actin antibody (1:1000) to control for equal protein loading (lower panel). (C) Mtb-infected macrophages were subjected to immunogold staining with control irrelevant antibody (Irr. Ab, left image) or Cpn60.2 antibody at 1:50 (right image) and revealed with ultra-small goat anti-rabbit IgG (1:50) as described (Sun et al., 2013). Long arrows indicate translocated Cpn60.2 into macrophage cytosol whereas short arrows denote the phagosomal membranes surrounding the phagosome-enclosed bacteria (marked as ‘B’). Data in A and B are representative of three independent experiments.

