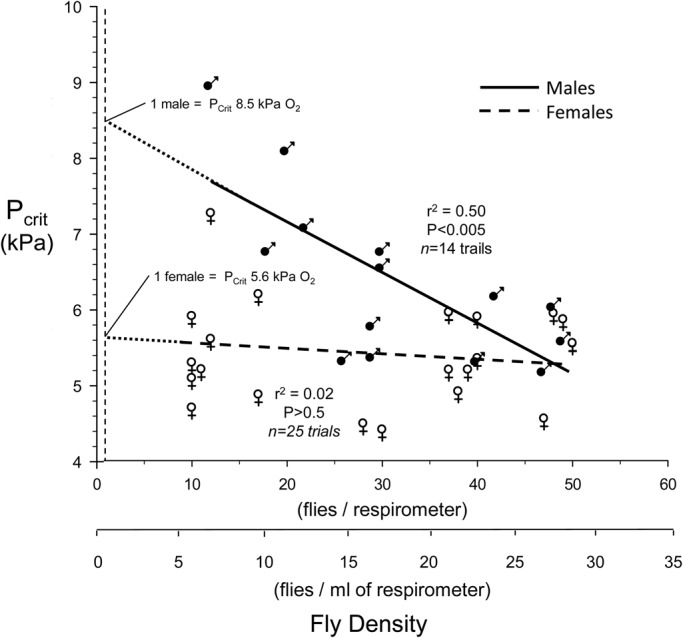
Fig. 5.

PCrit as a function of respirometer fly density in male and female D. melanogaster. Density is shown on both a per respirometer and per ml of respirometer basis. Separate linear regressions for male (n=14) and female (n=25) flies are provided, along with the correlation coefficient and P value for each (least squares method). Dashed lines represent the extrapolation of each relationship back to the value for a single fly. The slope of the line for female flies was not significant (P>0.05), indicating that PCrit in females as lines was unaffected by fly density.
