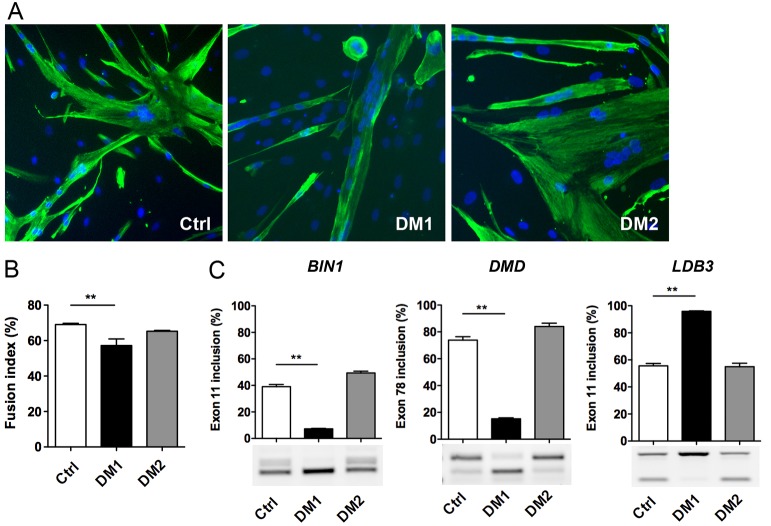
Fig. 1.
Features of primary DM muscle cells. (A) Control (Ctrl), DM1 and DM2 primary myoblasts were differentiated for 4 days and then fixed for immunofluorescence analysis using desmin antibody (green) and nuclei staining (blue) with Hoechst. (B) The fusion index of differentiated primary muscle cell cultures determined by the percentage of the number of nuclei in myotubes (>2 myonuclei) to the total number of nuclei in desmin-positive cells (n=4 for Ctrl, n=3 for DM1 and DM2, >1000 nuclei counted per experiment). (C) RT-PCR analysis of alternative splicing profile of BIN1 exon 11, DMD exon 78 and LDB3 exon 11 for differentiated cultures of Ctrl, DM1 and DM2 primary muscle cells (n=3 in duplicate for each condition). Data are expressed as mean±s.e.m. Comparison with one-way ANOVA with Newman-Keuls post-test; **P<0.01.

