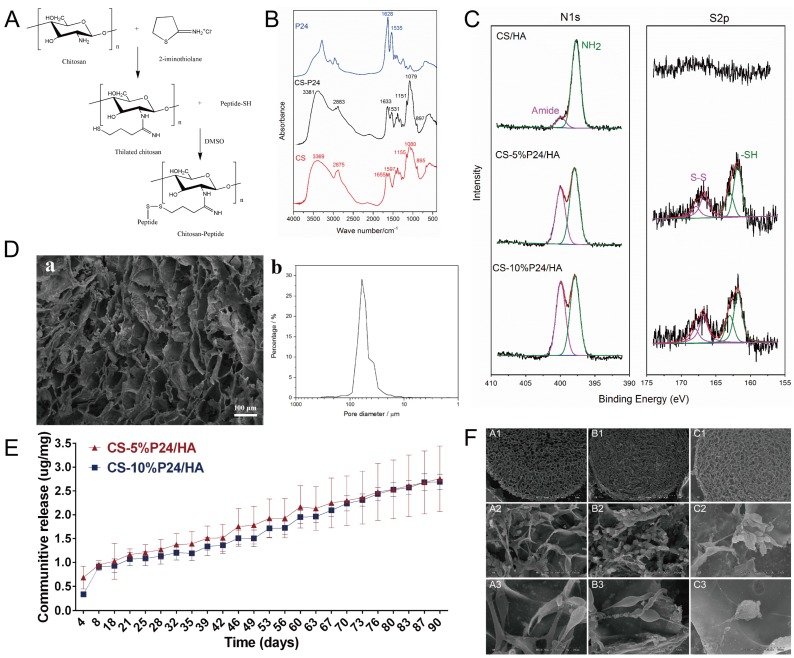
Figure 1.
(A) Synthesized thiolated chitosan and chitosan peptide. (B) FTIR spectra of CS, P24, and CS-P24. (C) N1s and S2p high-resolution XPS spectra of CS/HA, CS-5%P24/HA, and CS-10%P24/HA scaffolds. (D) SEM image (a) and distribution of pore diameter (b) of CS-P24/HA scaffold. (E) Cumulative in vitro release curves of the CS-P24/HA scaffolds over a period of 90 days. Data were obtained using an ELISA assay. Error bars represent means ± SD (n = 3). (F) Scanning electron microscope (SEM) images of (A1-A3) CS/HA, (B1-B3) CS-5%P24/HA, and (C1-C3) CS-10%P24/HA. (A1, B1, C1) SEM images of the porous biomaterial (30×). (A2, B2, C2) Scaffolds adhered with BMSCs (500×). (A3, B3, C3) The surface of the scaffolds with complex 3D structures (2000×).

