Figure 6.
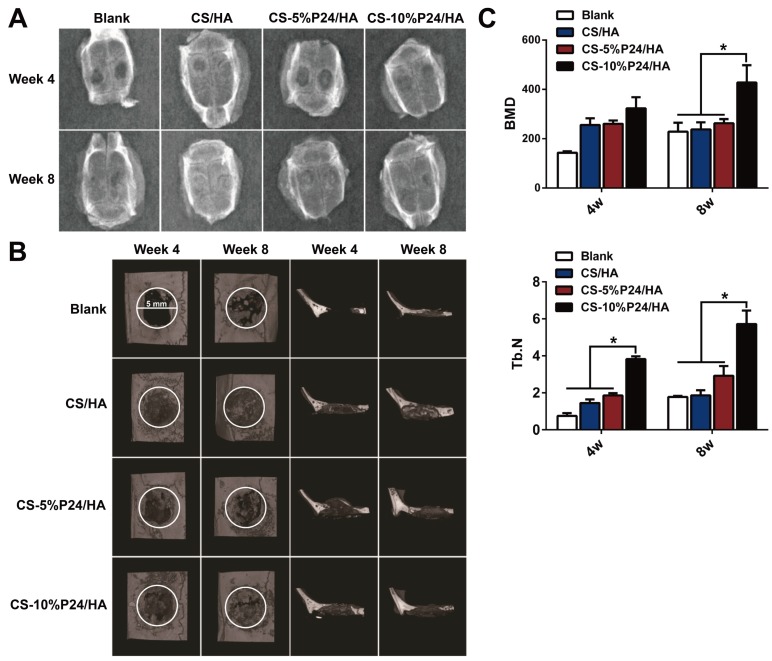
(A) X-ray examination of the whole calvarias post-implantation at weeks 4 and 8 in vivo. X-ray examination of the whole calvarias of Blank, CS/HA, CS-5%P24/HA, and CS-10%P24/HA groups, indicating new bone formation at the defects. (B) 3D micro-CT reconstructed images at 4 and 8 weeks with different implants. (C). Micro-CT examination of the whole calvarias after 4 and 8 weeks implantation in vivo. Bone mineral density (BMD) and trabecular number (Tb.N). *p < 0.05.

