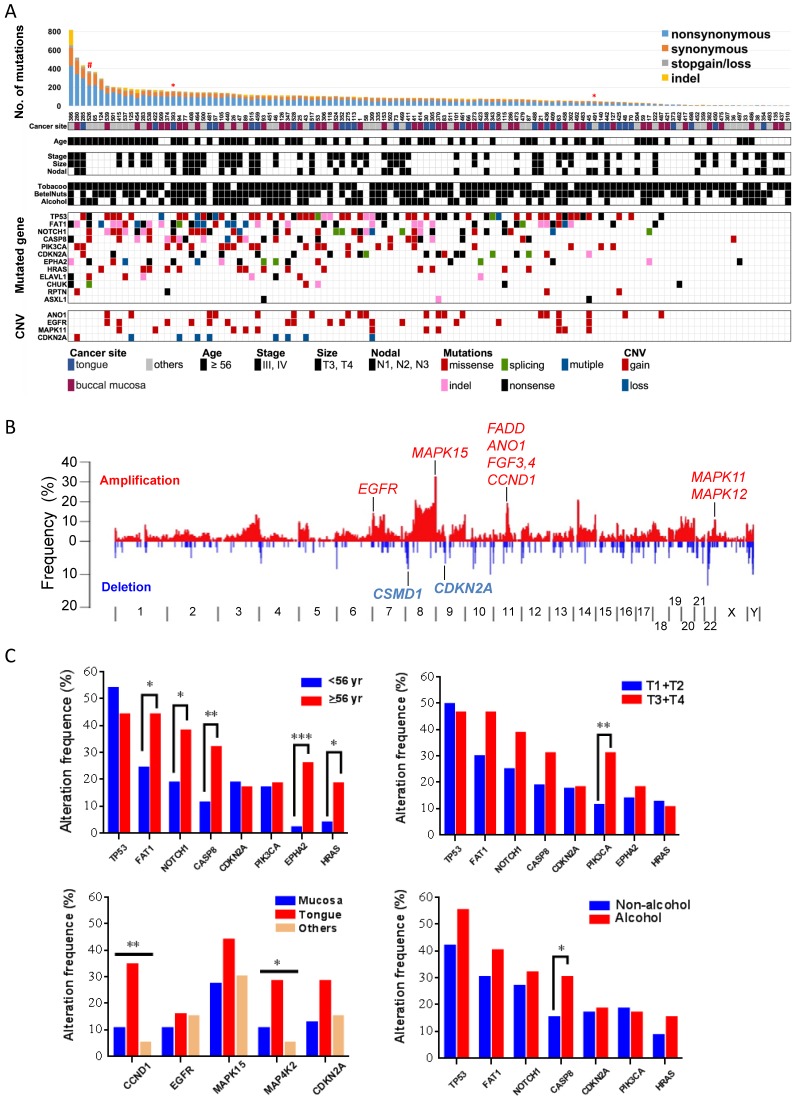
Figure 2.
Significantly altered genes in OSCC (A) Mutation rate, demographic and clinical features, environmental exposures and landscape of genomic alterations of 120 OSCC patients. Patients exposed to environmental risks are indicated as a filled square. *, subjected to whole-genome sequencing; #, germline POLD1 mutation. (B) Frequency of SCNAs along the genome. The vertical axis indicates the frequency of SCNAs in the cohort. Selected genes in recurrent amplifications and deletions are labeled. (C) Correlation of gene alteration status with demographic and clinical parameters. *p < 0.05, **p < 0.01, ***p < 0.001, χ2 test for trends in proportion.

