Figure 3.
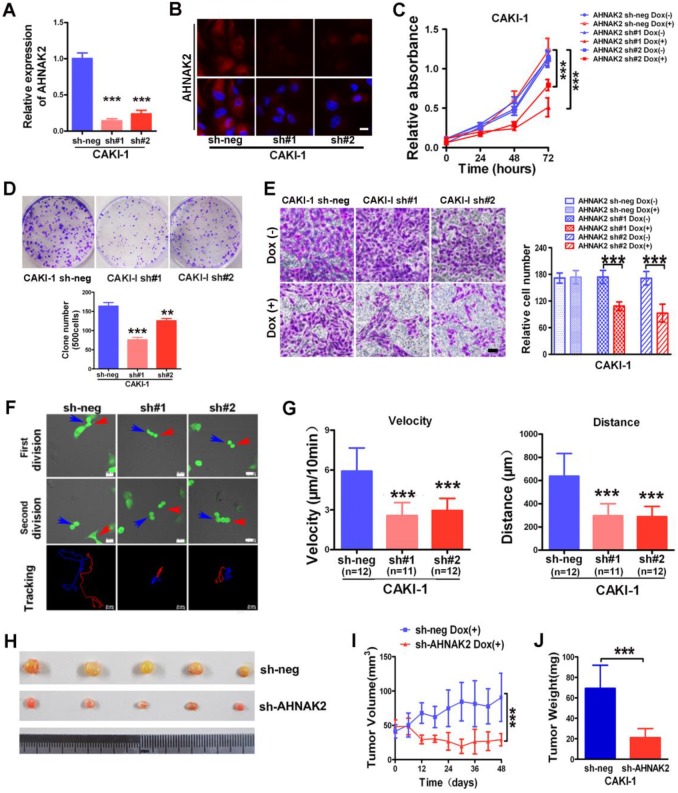
AHNAK2 knockdown inhibits the growth of ccRCC in vitro and in vivo. (A) CAKI-1 cells stably transfected with shRNAs were treated with doxycycline (1 μg/ml) for 7 days and performed by quantitative RT-PCR analysis. *** p < 0.001. (B) Representative immunofluorescence staining of AHNAK2 expression in each of the indicated cell lines. Scale bar = 20 μm. (C) The growth inhibition rates were measured by cell counting kit 8 assay at 0, 24, 48, and 72 hours in CAKI-1 cells stably transfected with different AHNAK2 short hairpin RNAs(sh#1 and #2) or control shRNA (sh-neg) after Doxycycline treatment for 7 days or not. ** p < 0.01, *** p < 0.001. (D) Representative images of clonogenic assays of CAKI-1 cells stably expressing AHNAK2 shRNAs (sh#1 and #2) or control shRNA. ** p < 0.01, *** p < 0.001. (E) Representative images of migration assays in CAKI-1 cells (left) and quantification of the relative migration cell number (right). Scale bar = 100 μm. ** p < 0.01, *** p < 0.001. (F) Representative time-lapse tracking images of CAKI-1 with sh-neg or sh-AHNAK2 #1 or #2 during one cell cycle. Each colored line in the bottom panels indicates the migration trace of each cell labeled by arrowhead. (G) Quantitative analysis of directional migration. The left panels indicate the distances and right panels show the velocity of cell migration. *** p < 0.001. (H) Representative images of xenografts derived from CAKI-1 stably transfected with control sh-neg and AHNAK2 sh#1. (n = 5/group). (I) Tumor volume and (J) weights of xenografts derived from control or AHNAK2-knockdowned CAKI-1 cells were evaluated. Each bar represents Mean ± SD in (H) and (I). Two-sided t test. *** p < 0.001.

