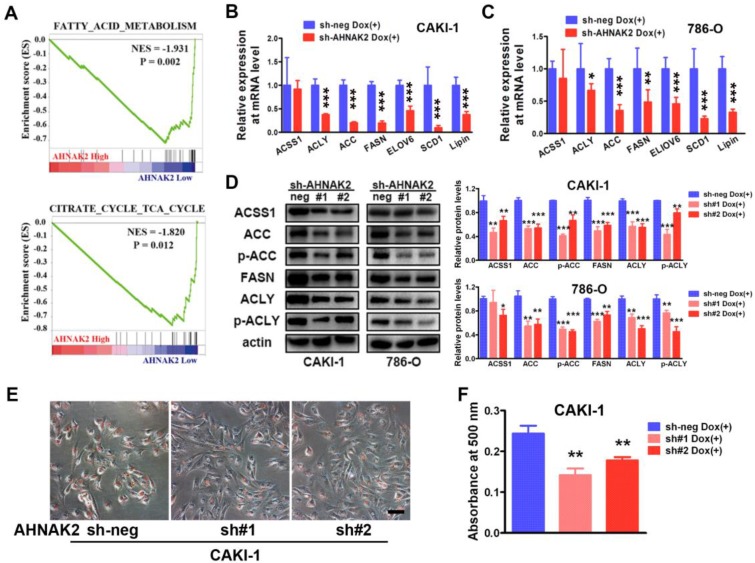
Figure 4.
AHNAK2 knockdown inhibits lipid synthesis in ccRCC cells. (A) The two gene set enrichment analysis (GSEA) profiles (from top ten) for the altered genes data by comparing the AHNAK2 high and low expression sample groups from TCGA data set are shown. NES = normalized enrichment score. (B-C) Quantitative RT-PCR assay was performed to measure the mRNA level of the genes related to lipid synthesis in CAKI-1 and 786-O cells with AHNAK2 knockdown or not. Each bar in the grafts represents Mean ± SD of three independent experiments. Two-sided t test. * p < 0.05, ** p < 0.01, *** p < 0.001. (D) Each cell line as (B and C) was subjected to Western blot analysis to confirm the expression levels of genes related to lipid synthesis. Quantification of the indicated protein level (normalized to actin). The means ± SD from 3 experiments were shown. (E) Oil-Red O staining analysis of lipid droplets in CAKI-1 cells stably transfected AHNAK2 shRNA (sh#1 or sh#2) or control shRNA (sh-neg). (F) Quantitative analysis of lipid droplet formation. To quantify the amount of Oil-Red O after staining the cells, the dye was eluted with 100% isopropanol, and the absorbance was measured at a spectrophotometer at 500 nm (right).

