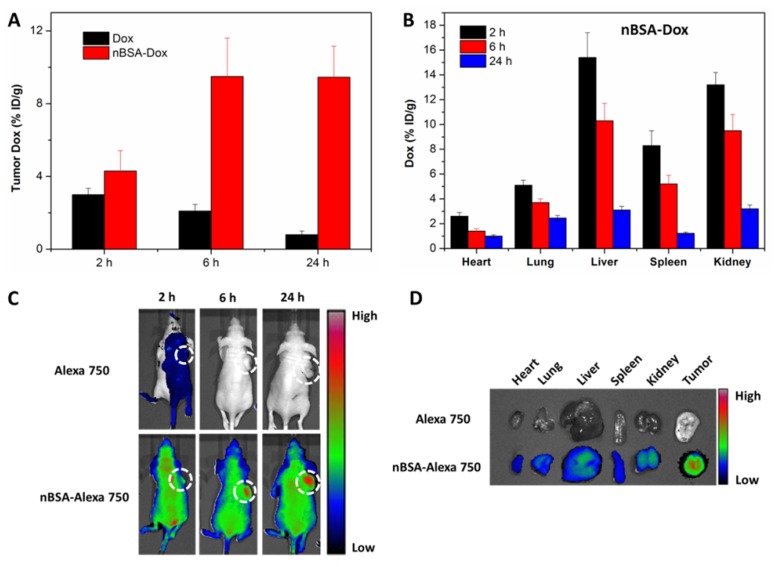
Figure 7.
Biodistribution analysis and in vivo imaging of SCID nude mice bearing HepG2 cells xenograft. The Dox concentration in tumor tissue (A) and other organs (B) at 2, 6 and 24 h after the tail vein injection of nBSA-Dox. (C) Time-lapse NIR fluorescence images of nude mice after the tail vein injection of nBSA-Alexa 750. The tumors were circled with a dotted line. (D) NIR fluorescence images of the major organs and tumors after 24 h injection.

