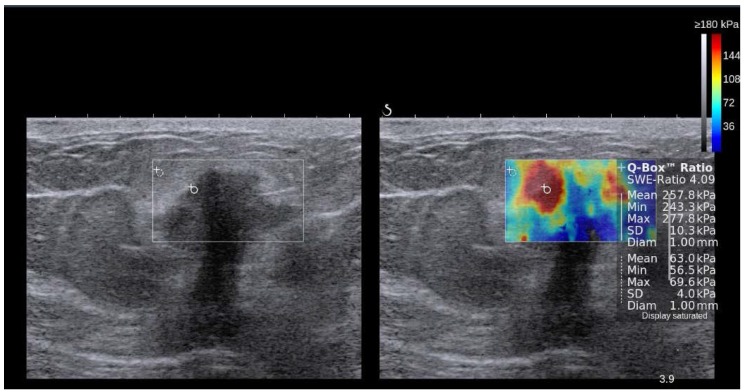
Figure 7.
Side-by-side display of anatomical B-mode US image (left) and overlaid color map of simultaneous shear wave measurements (right) of a breast lesion obtained with 2D-SWE on a SuperSonic Imagine (SSI) AixplorerTM. In this system, red color represents stiff tissue and blue color reflects soft tissue. The suspicious hypoechoic lesion (shown within rectangle on B-mode image) has an irregular border, angular margins, is slightly wider than tall and shows posterior acoustic shadowing. The elastogram suggested malignant etiology due to increased stiffness (red/yellow/green) and ductal adenocarcinoma was confirmed on subsequent biopsy. Image courtesy by Dr. Osmar Saito.

