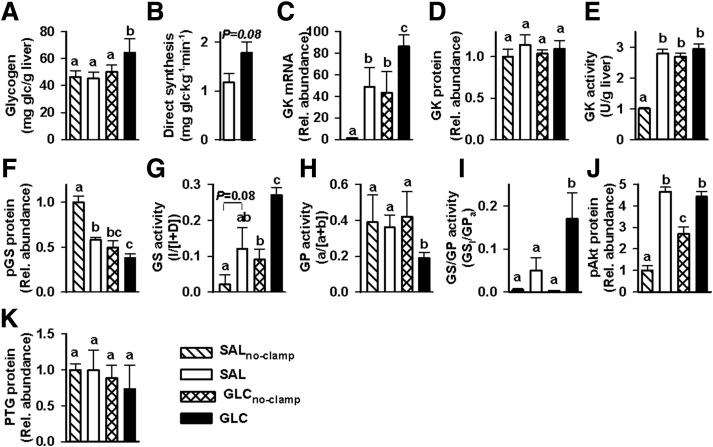
Figure 4.
Hepatic tissue analyses: glycogen concentrations (A), glycogen synthesis via the direct pathway (B), GK mRNA (C), relative (Rel.) GK protein (D), GK activity (E), pGS protein (F), GS activity (active/total) (G), GP activity (active/total) (H), GS activity relative to that of GP (I), pAKT protein (J), and relative PTG protein (K) in the SALno-clamp (hatched bars), SAL (white bars), GLCno-clamp (cross-hatched bars), and GLC (black bars) groups. Samples were taken at the end of study (360 min for the no-clamp groups and 600 min for the SAL and GLC groups). RNA and protein levels in the SAL, GLCno-clamp, and GLC groups are expressed relative to those in the SALno-clamp group. Direct glycogen synthesis is not shown for the no-clamp groups because they received no [3H]glucose. Data marked with different lowercase letters differed significantly from one another (P < 0.05), whereas those marked with the same letter were not significantly different from one another.

