Figure 3.
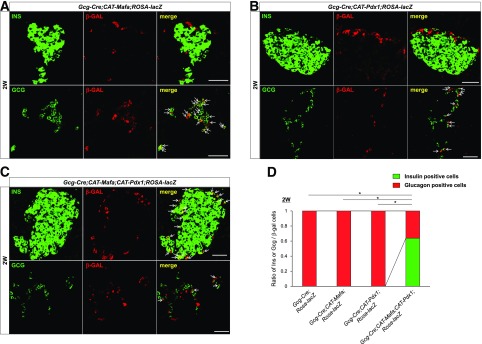
Mafa + Pdx1 produces insulin-positive cells from α-cells. Insulin, glucagon, and β-gal staining was performed in the Gcg-Cre;CAT-Mafa;ROSA-LacZ (A), Gcg-Cre;CAT-Pdx1;ROSA-LacZ (B), and Gcg-Cre;CAT-Mafa;CAT-Pdx1;ROSA-LacZ (C) pancreas. The arrows in A and B illustrate that Gcg-Cre activates ROSA-LacZ reporter expression in only α-cells. Because Gcg-Cre was expressed in only ∼35% of α-cells, a nonrepresentative islet image is shown to more clearly illustrate the extent of glucagon-positive–to–insulin-positive cell conversion in Gcg-Cre;CAT-Mafa;CAT-Pdx1;ROSA-LacZ islets. The arrows show that a large fraction of β-gal–positive cells express insulin by 2 weeks in the Gcg-Cre;CAT-Mafa;CAT-Pdx1;ROSA-LacZ pancreas (C). D: The ratio of insulin-positive, glucagon-positive, and insulin + glucagon–positive cells within β-gal–positive cells to total β-gal–positive cells at 2 weeks in Gcg-Cre;ROSA-LacZ, Gcg-Cre;CAT-Mafa;ROSA-LacZ, Gcg-Cre;CAT-Pdx1;ROSA-LacZ, and Gcg-Cre;CAT-Mafa;CAT-Pdx1;ROSA-LacZ is displayed, and the ratio of insulin-positive cells is compared. n = 4. 2W, 2 weeks; INS, insulin. *P < 0.001. Scale bars: 50 μm.

