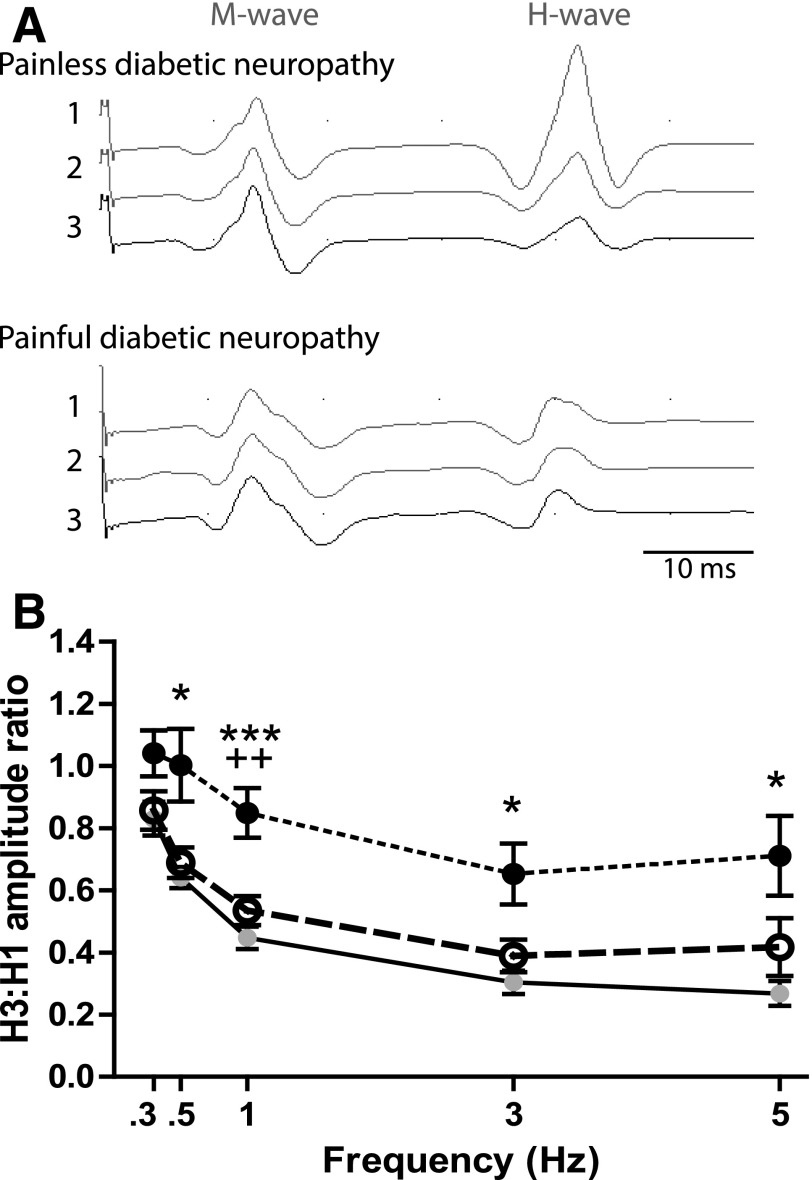
Figure 4.
Tibial H-reflex RDD is attenuated in patients with painful diabetic neuropathy. A: Representative electromyogram traces showing M and H waves in response to three consecutive stimulations at 1-Hz frequency in a patient with painless (upper triplicate) and painful (lower triplicate) diabetic neuropathy. Note the decline of the H-wave amplitude in the traces from the patient with painless neuropathy that illustrates RDD. B: RDD, expressed as H3-to-H1 ratio, at ascending stimulation frequencies in control subjects (n = 15: filled gray circles, solid line) and patients with painless (n = 14: open circles, large dashed line) and painful (n = 13: filled black circles, small dashed line) diabetic neuropathy. Data are group mean ± SEM. Statistically significant differences were identified with the Kruskal-Wallis test followed by Dunn post hoc test for multiple comparisons: *P < 0.05, ***P < 0.001 for painful diabetic neuropathy against control group; ++P < 0.01 for painful diabetic neuropathy against painless diabetic neuropathy.

