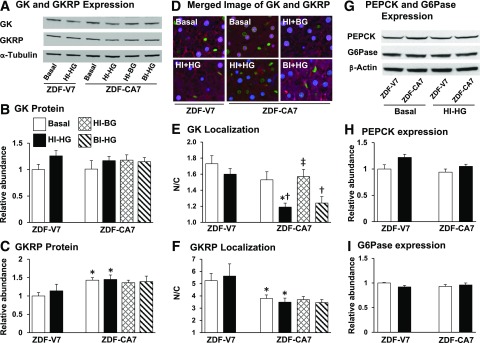
Figure 6.
Hepatic intracellular localization of GK and GKRP and expression of GK, GKRP, PEPCK, and G6Pase at the end of the test period (basal [no clamp condition, hyperinsulinemic-hyperglycemic [HI-HG], hyperinsulinemic–basal glycemic [HI-BG], and basal insulinemic–hyperglycemic clamp [BI- HG]) in ZDF rats treated with either vehicle (ZDF-V7) or an SGLT2-I (ZDF-CA7) for 7 days before each study. A: Representative Western blot images of GK, GKRP, and α-tubulin. B and C: Quantitative analysis of Western blot images of GK (B) and GKRP (C). D: Merged images of the immunoreactivity associated with GK and GKRP. E and F: Nuclear-to-cytosolic ratio of immunoreactivity of GK (E) and GKRP (F). G: Western blot images of PEPCK, G6Pase, and β-actin. H and I: Quantitative analysis of Western blot images of PEPCK (H) and G6Pase (I). GK, GKRP, PEPCK, and G6Pase levels are normalized to the average basal value of ZDF-V7. Values are the mean ± SEM of data from six animals in each group. *Significant difference from the corresponding values of the ZDF-V7 group within each treatment (P < 0.05); †significant difference from the basal values of the identical group (P < 0.05); ‡significant difference from the corresponding values under the HI-HG clamp of the identical group (P < 0.05).

