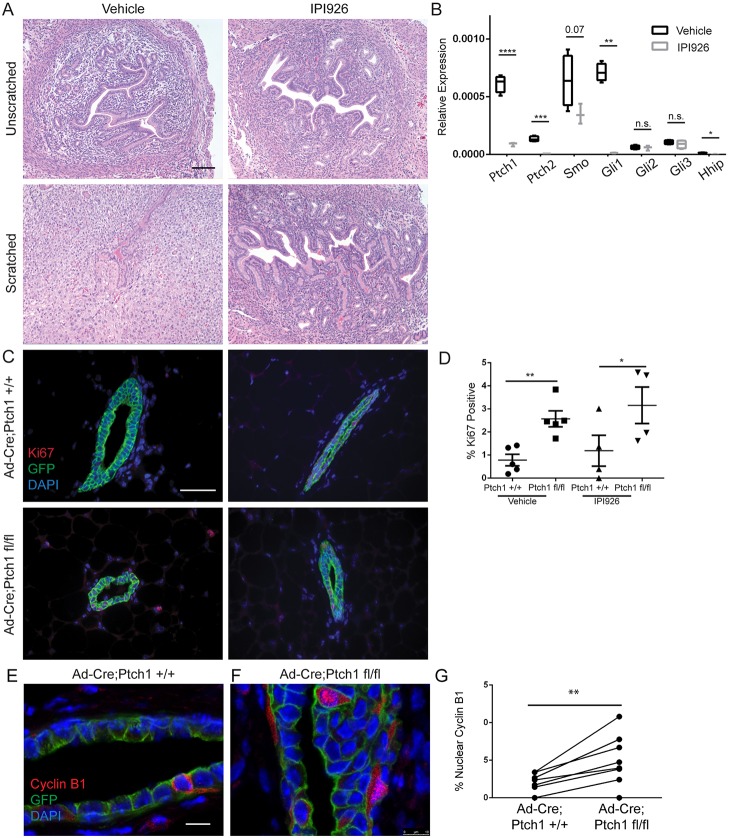
Fig. 2.
Hyperproliferation due to Ad-Cre-mediated Ptch1 loss is not due to SMO activation. (A) Hematoxylin and Eosin-stained vehicle-treated (left panels) and IPI926-treated (right panels) unscratched (upper panels) and scratched (lower panels) uterine tissue, showing decidualization in the vehicle-treated scratched uterus only. (B) qPCR of Ptch1+/+ and Ptch1fl/fl outgrowths showing no significant changes in hedgehog activation, aside from upregulation of Ptch2. Unpaired t-test are used for statistics. Data are represented as 2−dCt. (C) Ki67 and GFP co-stained vehicle-treated Ptch1+/+ (upper left), vehicle-treated Ptch1fl/fl (lower left), IPI926-treated Ptch1+/+ (upper right) and IPI926-treated Ptch1fl/fl ducts (lower right). (D) Quantification of the percentage of Ki67-positive cells by genotype, showing increased proliferation in vehicle and IPI926- treated mutant ducts relative to controls by paired t-test. (E,F) Confocal images of cyclin B1- stained Ptch1+/+ and Ptch1fl/fl ducts. (G) There is increased nuclear localization in Ptch1fl/fl ducts compared with controls (paired t-test). The scatterplot shows data as mean±s.e.m. Boxplots show data as mean±s.e.m., with minimum and maximum values. *P<0.05, **P<0.01, ***P<0.001 and ****P<0.0001. Scale bars: 50 µm in A,C; 10 µm in E,F.

