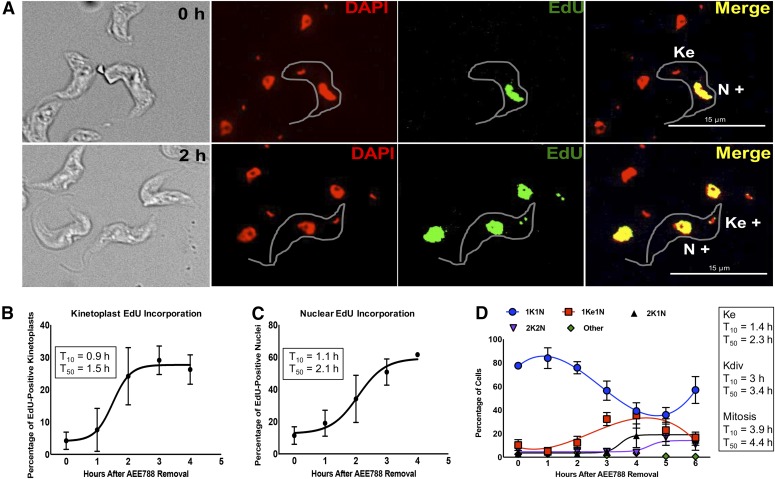
Fig. 5.
Time-course of DNA replication and division in the kinetoplast and nucleus after withdrawal of AEE788. Trypanosomes were treated with AEE788 (5 µM, 4 hours), rinsed, and placed in drug-free HMI-9 medium. The time-course of DNA synthesis was monitored by EdU incorporation, and DAPI was used to visualize the division of the kinetoplast and nucleus. (A) Representative images of trypanosomes directly after AEE788 treatment (0 hour, top) or 2 hours after AEE788 washout (bottom). Kinetoplasts and nuclei, in 100–150 trypanosomes, were scored as EdU-positive (K+ or N+) or EdU-negative. Scale bar, 15 µm. The average proportion of cells with EdU-positive kinetoplasts (B) or nuclei (C), are indicated at every hour after AEE788 withdrawal. S.D.s between independent experiments are shown (n = 6 for 0 and 2 hours; n = 4 for 1 hour; n = 3 for 3 and 4 hours). A sigmoidal nonlinear regression curve was fit to the data points using GraphPad Prism, and the time at which 10% (T10) or 50% (T50) of the population became EdU positive, compared with the observed maximum (4 hours), was calculated for kinetoplast (B) and nuclear (C) EdU incorporation. (D) The average percentage of cells (n = 115) with the indicated kinetoplast (K) and nucleus (N) configuration is shown for every hour after AEE788 withdrawal. The S.D. represents variation among three independent experiments. Data trends are represented by nonlinear regression curves using a third-order polynomial equation for 1K1N and 1Ke1N data, and a sigmoidal nonlinear regression curve for 2K1N and 2K2N populations. T10 and T50 values (calculated by GraphPad software) for each event are listed [T10 and T50 for the appearance of 1Ke1N cells is based on a sigmoidal nonlinear regression curve from 0 to 4 hours (maximum)].

