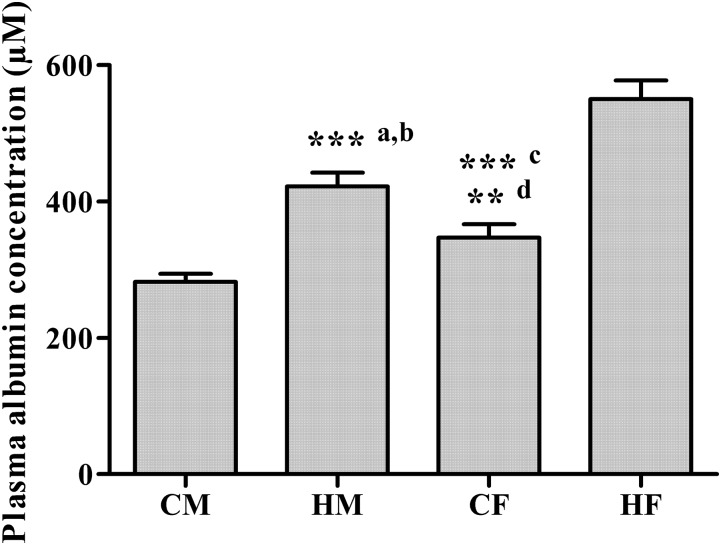
Fig. 2.
Plasma albumin concentrations in CIA males (CM), healthy males (HM), CIA females (CF), and healthy females (HF) determined by ELISA. a and b, ***P < 0.001, significant difference compared with CM and HF; c, ***P < 0.001, significant difference compared with HF; d, **P < 0.01, significant difference compared with CM.

