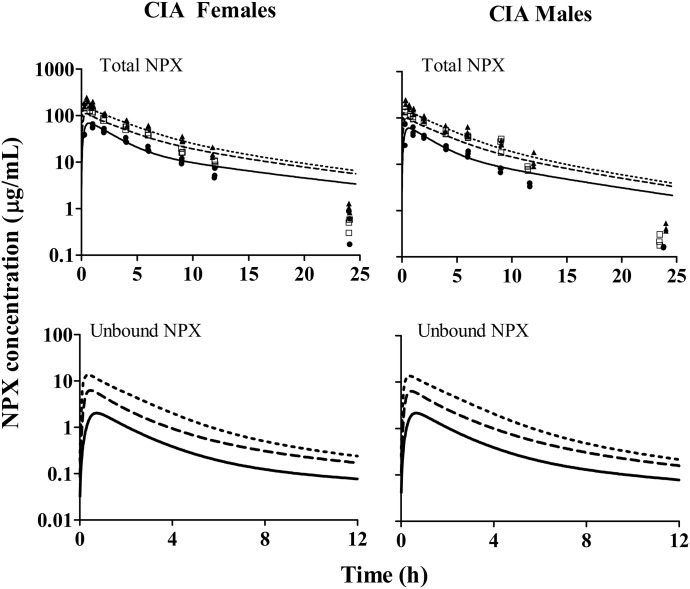
Fig. 5.
Plasma concentration versus time profiles of 10 mg/kg (solid circles and solid lines), 25 mg/kg (open squares and long dashed lines), and 50 mg/kg (solid triangles and short dashed lines) NPX in female (left panel) and male (right panel) arthritic rats. Symbols are observed total plasma concentrations of NPX. Curves in the upper panel depict model fittings jointly for all dose groups. Curves in the lower panel depict model-predicted unbound plasma concentrations of NPX.

