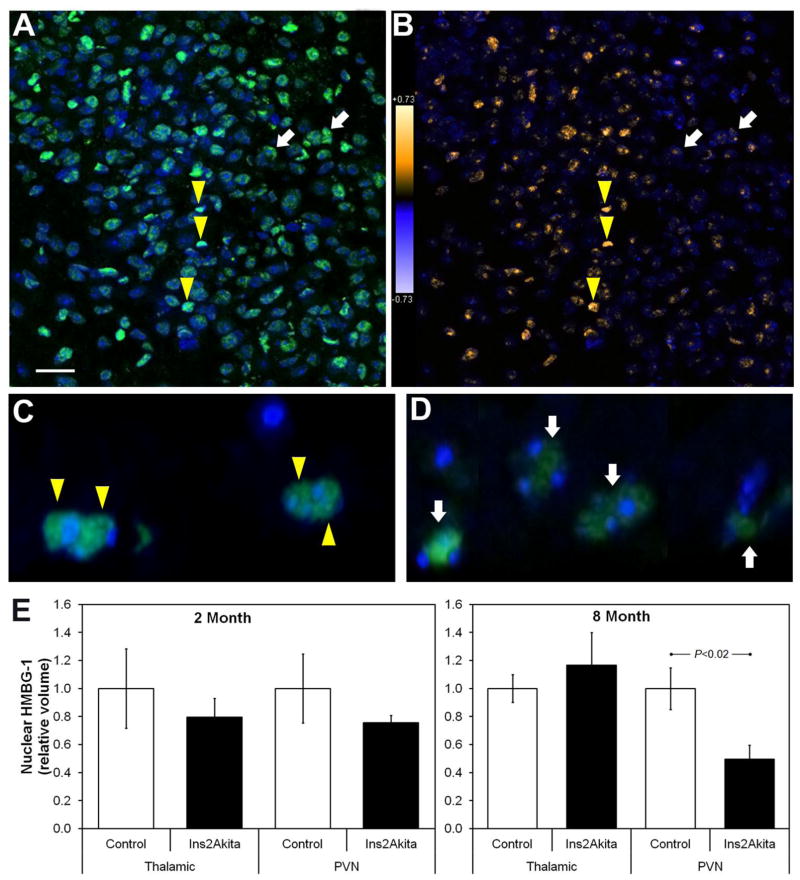
Figure 2. HMBG1 translocates from nucleus to cytoplasm with extended hyperglycemia – in the PVN of Ins2Akita mice.
(A) En face laser confocal microscopy image of a representative PVN region from a control mouse brain showing detection of nuclear (DAPI, blue) and HMBG1 (Alexa 488, green) fluorescence. (B) The same field as in (A) is shown after Intensity Correlation Analysis to determine the probability of colocalization. The analysis assigns warmer colors (yellows) to a high probability of colocalization and cooler colors to lower probability, allowing visualization of nuclear versus cytoplasmic HMBG1. The white arrows in (A–D) indicate typical cells with strong HMBG1 signal but low nuclear localization, while the yellow triangles show cells with strong nuclear HMBG1 localization. (C & D) Confocal microscopy depth projections of ~20 1μm sections of PVN regions. Aged-matched control (C) and 8-month diabetic Ins2Akita mice (D) illustrate HMBG1 nuclear localization and translocation at 100X. (E) Summary of quantitative volumetric morphometry measuring the degree of nuclear HMBG1. A significant reduction in nuclear HMBG1 was observed in the PVN of Ins2Akita mice after 8 months of diabetes. Scale bar: 25μm (A & B).

