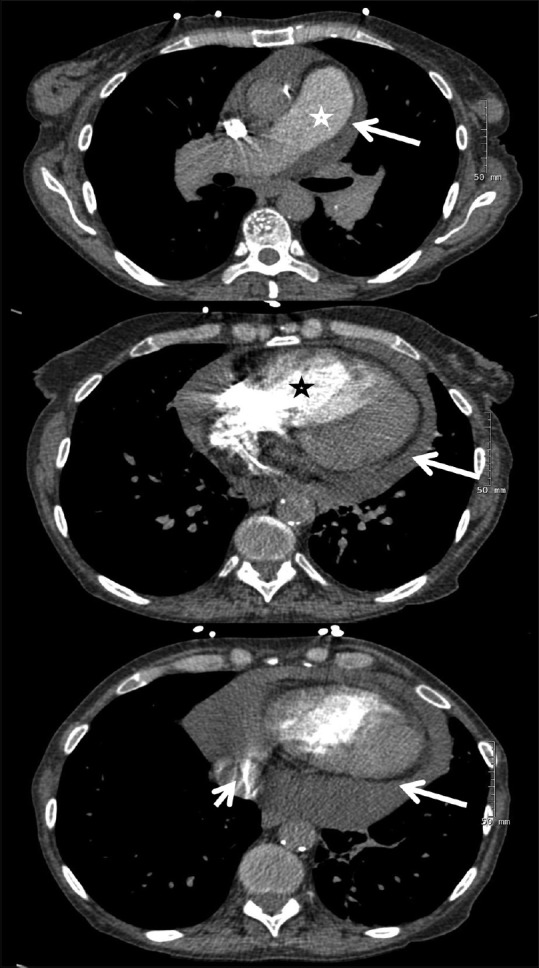
Figure 3.

Computed tomographic pulmonary angiography in a patient with idiopathic pulmonary arterial hypertension. Upper panel shows dilated pulmonary artery (star) and pericardial effusion (arrow). Center panel reveals a dilated right ventricle (star) with displacement of the interventricular septum toward the left ventricle and pericardial effusion (arrow). Lower panel shows iodine contrast in the inferior vena cava (short arrow) and pericardial effusion (long arrow)
