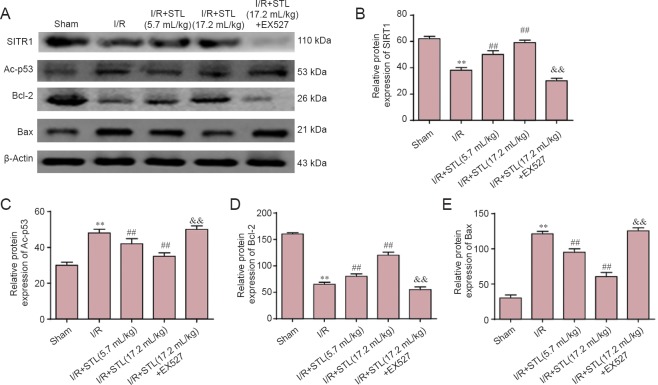
Figure 5.
Effects of STL on the protein expression of SIRT1, Ac-p53, Bcl-2 and Bax in the brain 24 hours after cerebral I/R.
(A) Western blot assay for protein expression in each group. (B–E) Density analysis of SIRT1 (B), Ac-p53 (C), Bcl-2 (D), and Bax (E) protein expression. β-Actin was used as a loading control. The protein expressions were expressed as the optical density percentage of the target protein to β-actin. Values are expressed as the mean ± SEM (n = 4 rats per group), and were analyzed by analysis of variance followed by the least significant difference test. **P < 0.01, vs. sham group; ##P < 0.01, vs. I/R group; &&P < 0.01, vs. I/R + STL (17.2 mL/kg) group. STL: Shuan-Tong-Ling; I/R: ischemia/reperfusion; Ac-p53: acetylated-protein 53; EX527: SIRT1 inhibitor; SIRT1: silent information regulator 1.

