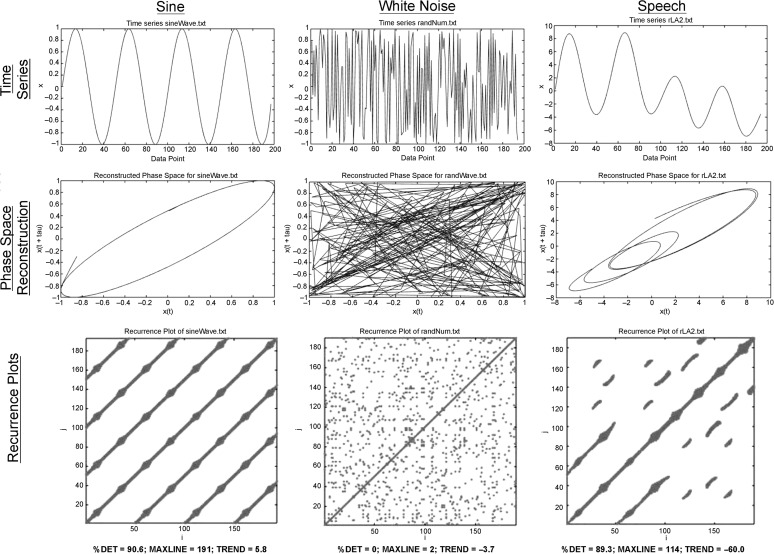
Figure 1.
RQA for three time series: Sine (left), white noise (center), and speech (right; from data set). Top row: Raw time series, with sample on the x-axis and amplitude on the y-axis. The speech signal reflects lip aperture during the utterance Buy Bobby a puppy. Middle row: Phase space reconstructions, with amplitude for original signal on the x-axis and time-delayed signal on the y-axis. Parameters: EMBED = 4; DELAY = 2; radius = 15%; line length = 5. Bottom row: Recurrence plots for each signal; original trajectory is reflected on the x-axis and time-delayed trajectory is reflected on the y-axis. Corresponding percent determinism (%DET), longest repeated string of data points in the time series (MAXLINE), and measure of stationarity (TREND) indexes are provided at the bottom.

