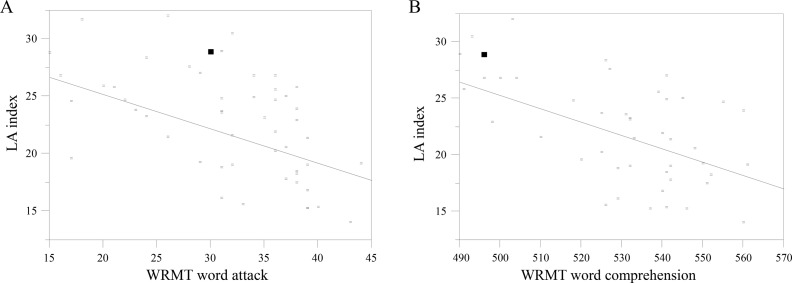
Figure 7.
Panel A shows the regression line representing the correlation between Woodcock Reading Mastery Tests–Revised (WRMT-R/NU) word attack raw scores and overall lip aperture (LA) variability in the two adult groups. Panel B shows the regression line representing the correlation between WRMT-R/NU word comprehension w-scores and overall LA variability in the two adult groups.

