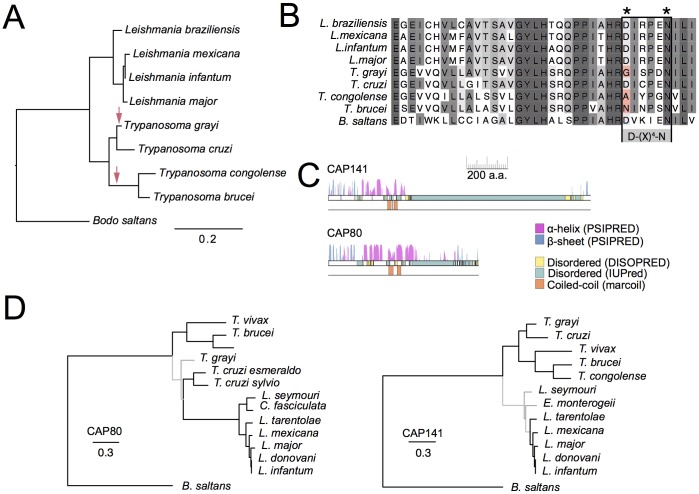
Fig. 3.
Sequence and phylogenetic analysis of newly identified clathrin-associated proteins. (A) Phylogenetic tree of the TbAAKL family across the kinetoplastids. Red arrows mark potential occurrences of mutations predicted to render the kinase inactive. (B) Sequence alignment showing putative inactivating mutations in kinetoplastid TbAAKL family kinases (asterisks). (C) Secondary structure predictions for TbCAP141 and TbCAP80. Note similarities with predicted extreme N-terminal β-rich regions followed by α-rich regions containing putative coiled coils and large disordered domains at the C-termini. (D) Phylogenetic analyses of TbCAP141 and TbCAP80 families showing distribution across the kinetoplastids. Trees shown are best-scoring maximum likelihood trees (PhyML). Black branches are supported >80, >80 or >0.99 (as assessed by RaxML, PhyML abd MrBayes, respectively), grey branches are below this level of support.

