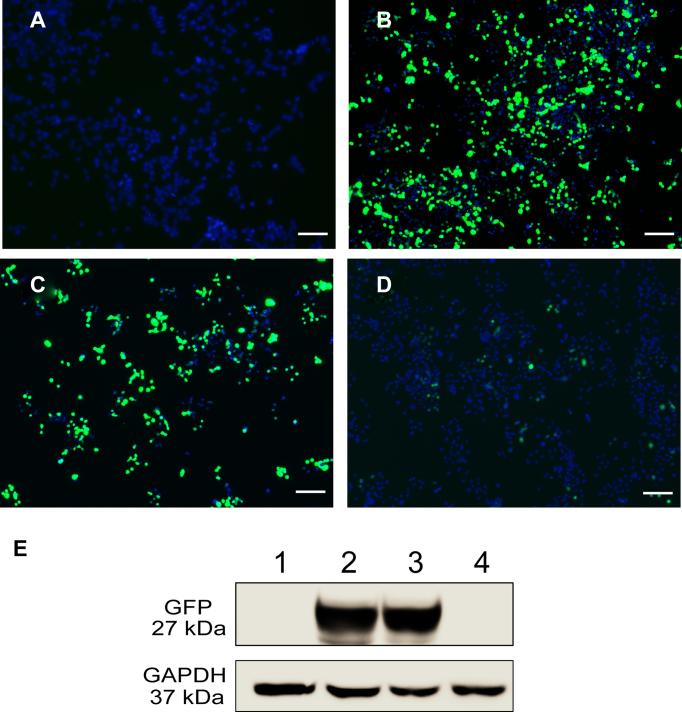
Figure 4.
Suppression of GFP expression by VLP–RNAiGFP in U87 cells. Cells were treated with (A) PBS, (B) a plasmid expressing GFP, (C) a plasmid expressing GFP followed, after 18 h, by treatment with 300 nM VLPWT, (D) a plasmid expressing GFP followed, after 18 h, by treatment with 300 nM of VLP–RNAiGFP. (E) Western blot analysis of GFP expression. Lane 1 shows the GFP expression of the cells corresponding to panel (A). Lane 2 shows expression of cells in panel (B). Lane 3 shows expression of cells in panel C. Lane 4 shows expression of cells in panel D. Green indicates GFP expression. Blue indicates nuclei. Images were obtained 48 h after transfection. Scale bar = 200 μm.

