
Fig. 6.
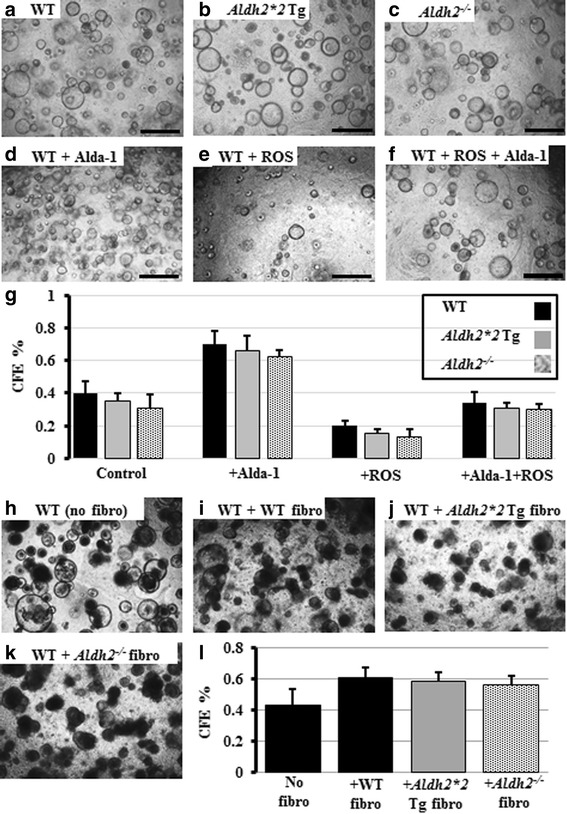
In vitro MTEC CFE of WT, Aldh2*2 Tg, and Aldh2 −/− mice. MTECs from all groups were collected and cultured in the 3D stem cell colony forming assay (a-c) and parallel culture wells were treated with H2O2, and/or the Aldh2 agonist, Alda-1. Representative images of MTECs from WT mice after treatments are shown in (d-f). Quantification of all wells from all groups is shown in (g). WT MTECs were cultured alone (h) or co-cultured with lung fibroblasts isolated from WT, Aldh2*2 Tg, and Aldh2 −/− mice (i-k). l Quantification of CFE from all co-culture wells