Fig. 1.

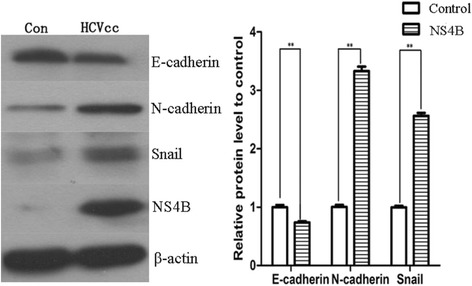
HCVcc-infected cells presented the changes of EMT. The expression of E-cadherin, N-cadherin and Snail in Huh7.5.1 cells (Control group) and HCVcc infected Huh7.5.1 cells (HCVcc group). *P < 0.05, **P < 0.01

HCVcc-infected cells presented the changes of EMT. The expression of E-cadherin, N-cadherin and Snail in Huh7.5.1 cells (Control group) and HCVcc infected Huh7.5.1 cells (HCVcc group). *P < 0.05, **P < 0.01